Devblog #3: ALS Logs; Elastic, RabbitMQ, Logstash & Filebeat
Let's talk about the logging stack used on ALS: Elastic, RabbitMQ, Logstash and Filebeat
1156 Words
2024-06-03 21:00 +0000 [Modified : 2024-06-03 22:00 +0000]
ALS Logging Stack
With 22 servers running overall for Apex Legends Status (=ALS) needs, having a centralized logging platform has quickly became mandatory to be able to access all logs when needed from a single place.
The dev blog will detail the most important parts of the logs flow, starting at Filebeat/RabbitMQ level, Logstash and finally the ELK stack.
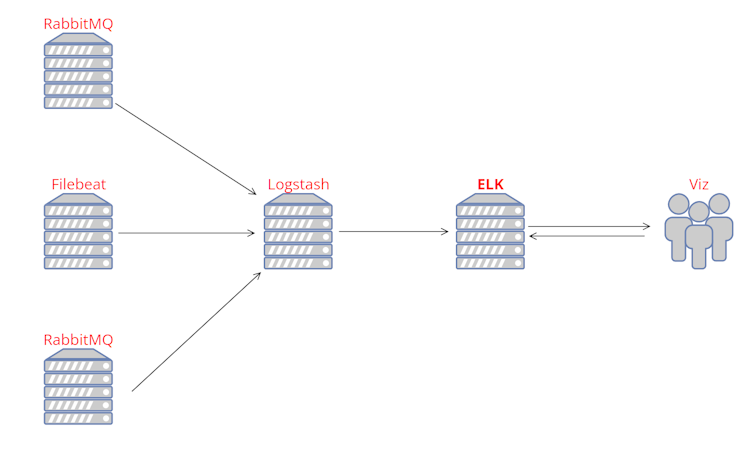
The infrastructure could be summed up as this, in a very simplistic way:
Data collection
RabbitMQ & AMQP
Most of the time, collecting logs from different sources is trivial (for example, with filebeat for Apache2 logs - which we’ll talk about shortly after). However, sometimes, when using more complex/home-made solutions, you have to think a bit outside the box. We’ll take a concrete example of ApexWS, the websocket server used within DGS (statistics platform for Apex Legends tournaments) that sends and receives events from the game client.
First of all, AMQP (Advanced Message Queuing Protocol) is a way for different systems to send messages to each other reliably. RabbitMQ is a popular tool that uses AMQP to manage and route these messages, here relaying messages between the DGS websocket server and Logstash. Hardware resources impact is very limited, and it can handle hundreds if not thousands of messages per seconds without issues.
Each time the DGS websocket server receives an event, the full payload is encoded into JSON and sent to the local RabbitMQ instance. It contains everything we want to log: the game event, user ID, current game ID, DGS server identifier, etc. RabbitMQ keeps that message into an internal RAM buffer until it is fetched and acknowledged by the remote Logstash instance. On DGS, all dedicated servers having their own complex systems will have their own RabbitMQ instances, linked to Logstash through distinct pipelines. It’s really important to set a max queue size on the rabbitMQ server, to avoid unwanted resources issues: in the event of a Logstash server failure, the messages would pile up in RabbitMQ… until the OOM killer comes by. I personally have a max queue of 10,000 (this should be adapted according to your events per second rate), which is enough to buffer messages while the Logstash server is restarting for example.
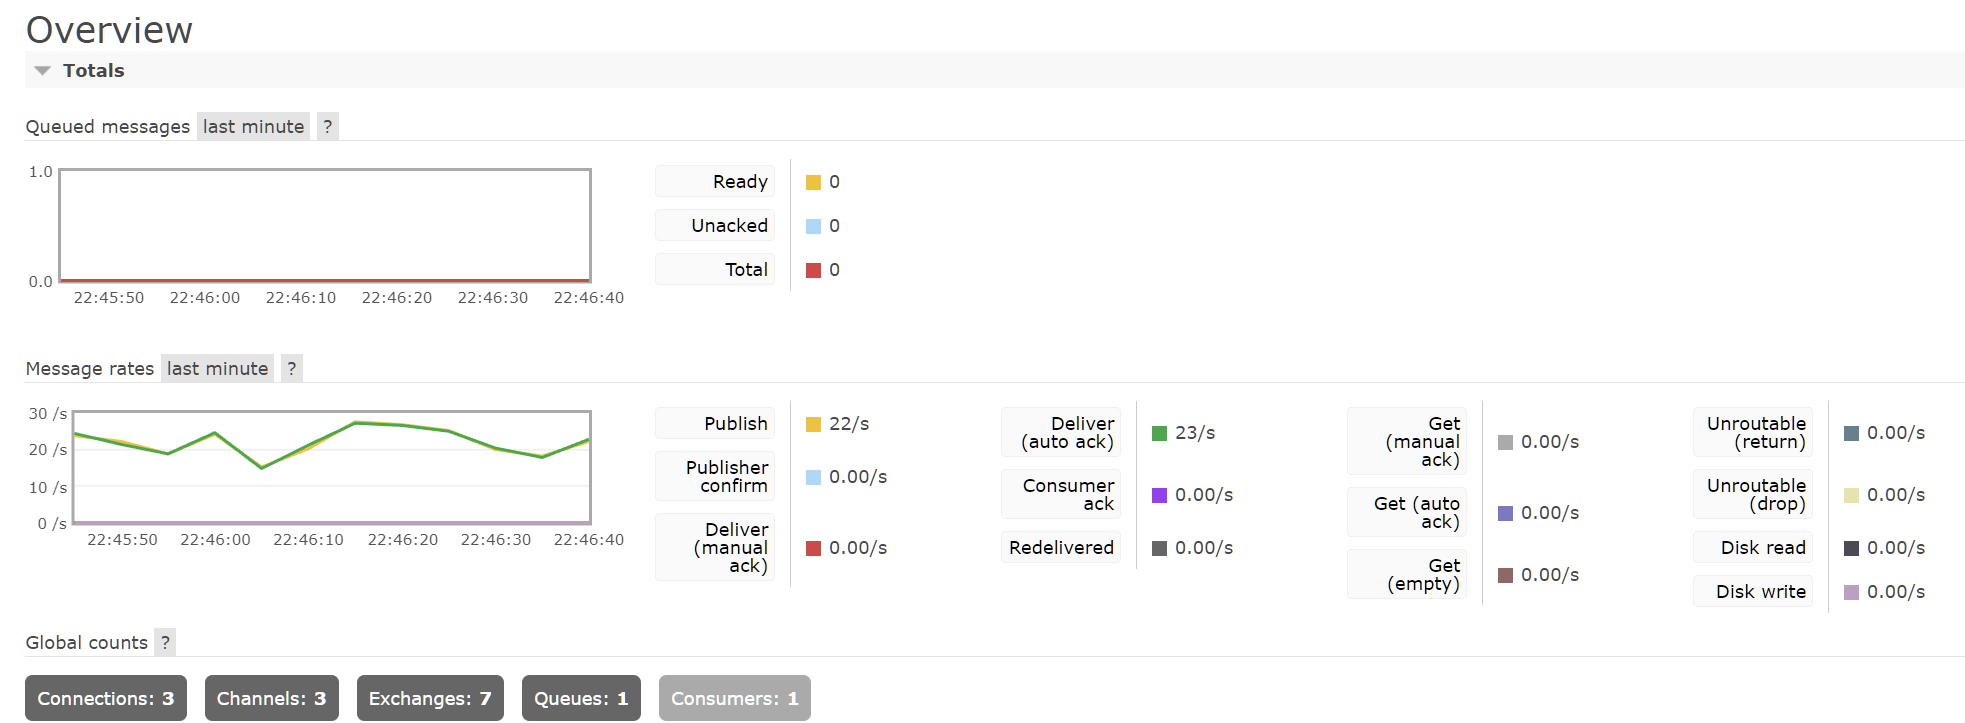
RabbitMQ comes with a wonderful web interface, as shown below. You can basically do everything you need from there and avoid using the CLI. It’s also great to have a quick overview on all the existing connections, the size of the buffer and the overall health of the system. UI doesn’t feel that modern, but it’s not really made to watch all day and it does the job perfectly.
For DGS websocket needs, all messages are sent to the same queue (ApexWS-prod which you will see below in the Logstash conf), having a unique identifier depending on the DGS server instance and the environment (prod, dev, ALGS).
Filebeat
For more common systems, such as the Apache2 web server, a simple Filebeat instance is deployed on all the needed hosts.
If we take ALS Apache2 logs as an example, it’s as easy as this:
filebeat.inputs:
- type: log
  enabled: true
  paths:
    - /var/log/apache2/apache2-access.log
  fields:
    log_type: apache2
    hostname: als-core
Filebeat will continuously read all the logs coming from the Apache2 access logs which are in a standard format, and forward it to the remote Logstash instance. The logstash step is not always needed, but it felt easier to implement with the pre-existing rabbitMQ infrastructure.
Data reception & Formatting
This part is handled by Logstash, on the core Elastic server. Each distinct log source has its own logstash pipeline listed in the pipelines.yml file. If we go back to our previous example of DGS websocket server, the pipeline is loaded as follows:
- pipeline.id: apexws
  path.config: "/etc/logstash/conf.d/logstash-apexws.conf"
Which points to the following config file:
input {

        rabbitmq {
                id => "rabbitmq_logs_apexws"
                host => "RABBITMQ_SOURCE_IP"
                port => RABBITMQ_SOURCE_PORT
                vhost => "/"
                queue => "ApexWS-prod"
                ack => false
                user => "RABBITMQ_USER"
                password => "RABBITMQ_PASSWORD"
                codec => "json"
        }
}

filter {
        mutate {
                remove_field => ["[event][original]"]
        }
}

output {
        elasticsearch {
                hosts => ["ELK_IP"]
                index => "dgs-apexws-%{+YYYY.MM.dd}"
                user => "LOGSTASH_USER"
                password => "LOGSTASH_PASSWORD"
        }
}
This config will fetch all the events in the RabbitMQ buffer, decode the JSON, and output it into ELK in the designated index. The config file is roughly the same for all pipelines, other than the input which may change, and the destination index.
Data indexing & Viz
Now that our data is indexed into Elastic, we can make some really cool stuff with it.
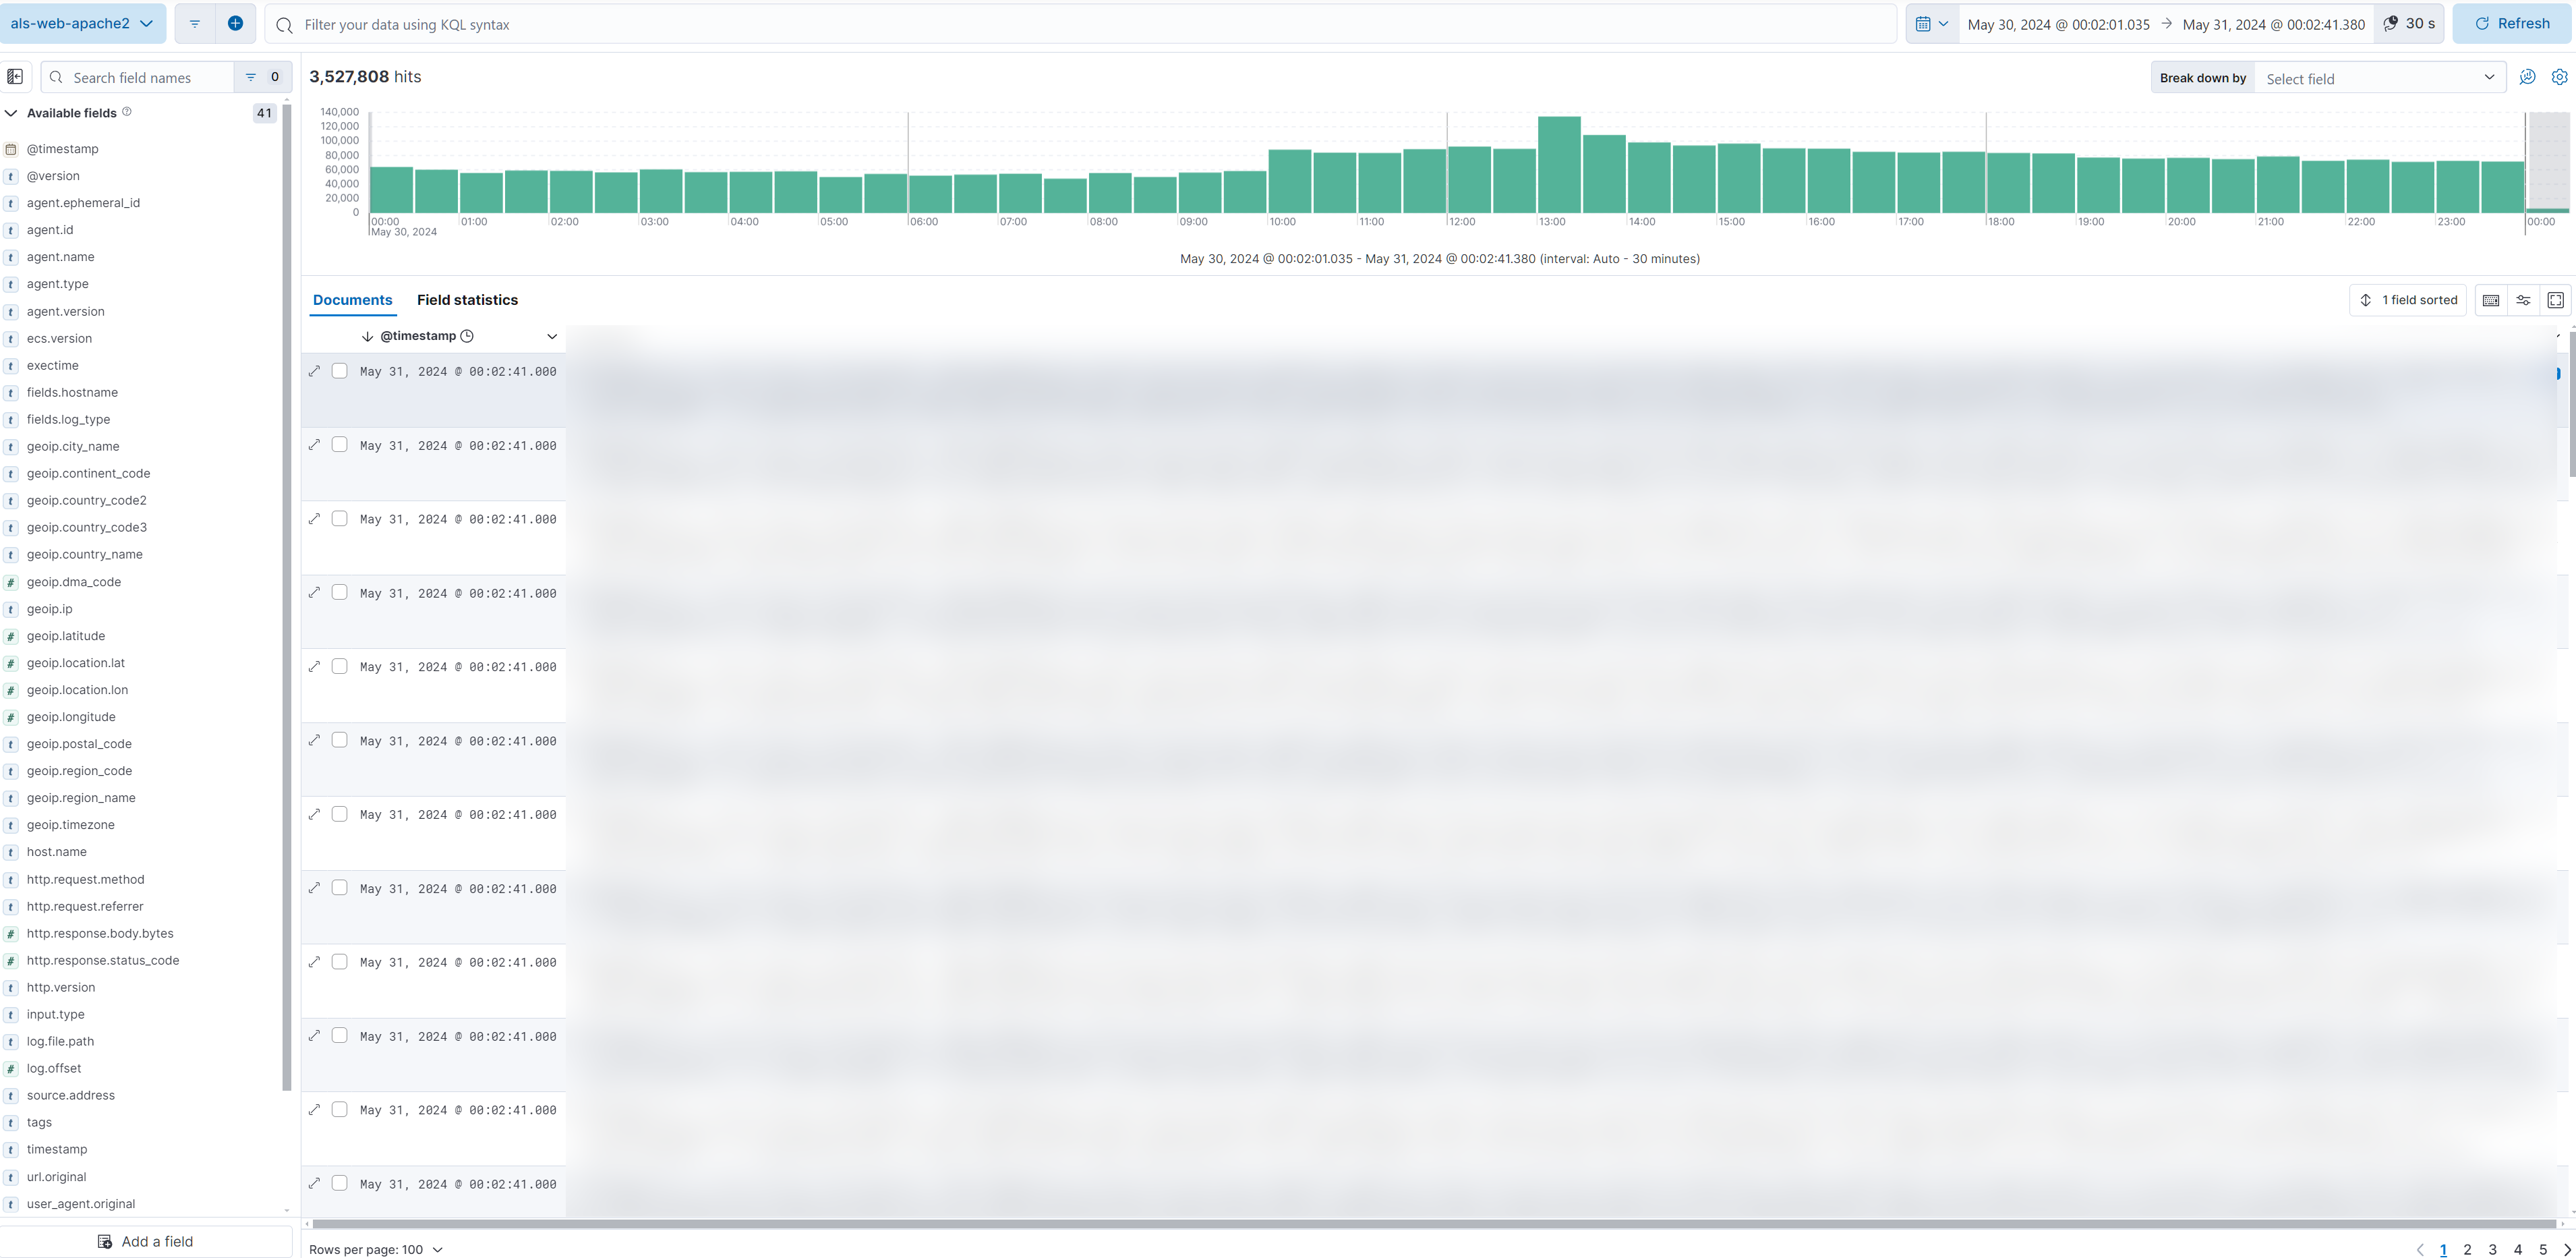
We start by creating index patterns, which will basically allow us to query all matching indexes as the same data source: it’s usually recommended to create a separate index for each day for performance and ease of data retention policies. By taking the example logstash config above, dgs-apexws-%{+YYYY.MM.dd} data will be indexed into the index with the current date. All the entries are then visible in the Discover section of Elastic:
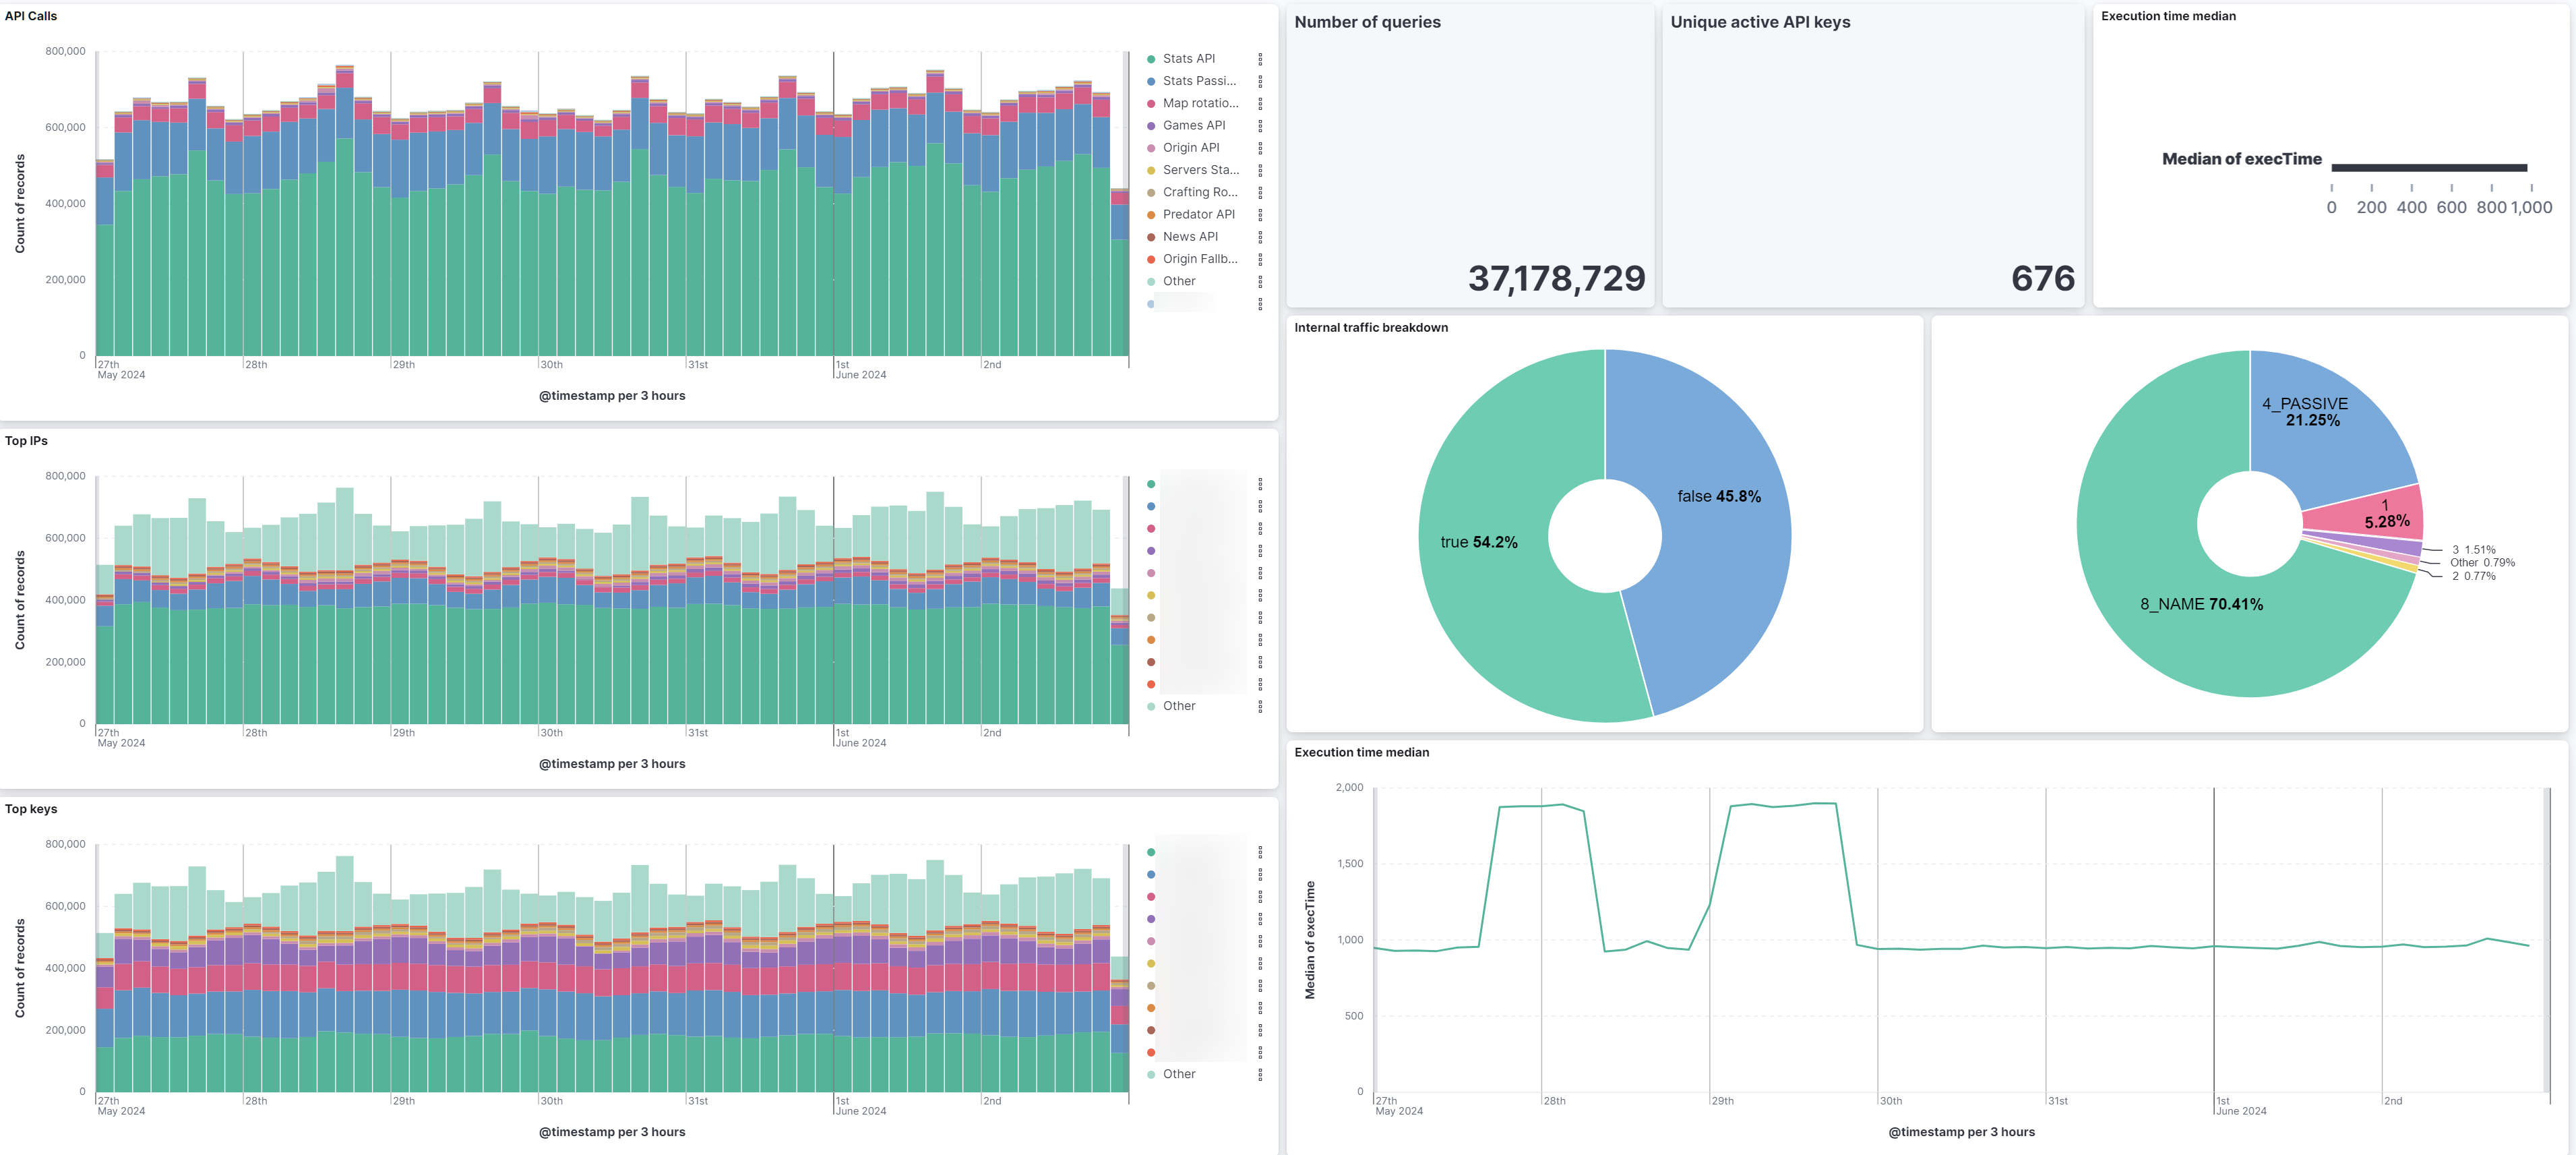
But it doesn’t stop there! The most interesting part is the ability to create custom visualizations, and most importantly: dashboards.
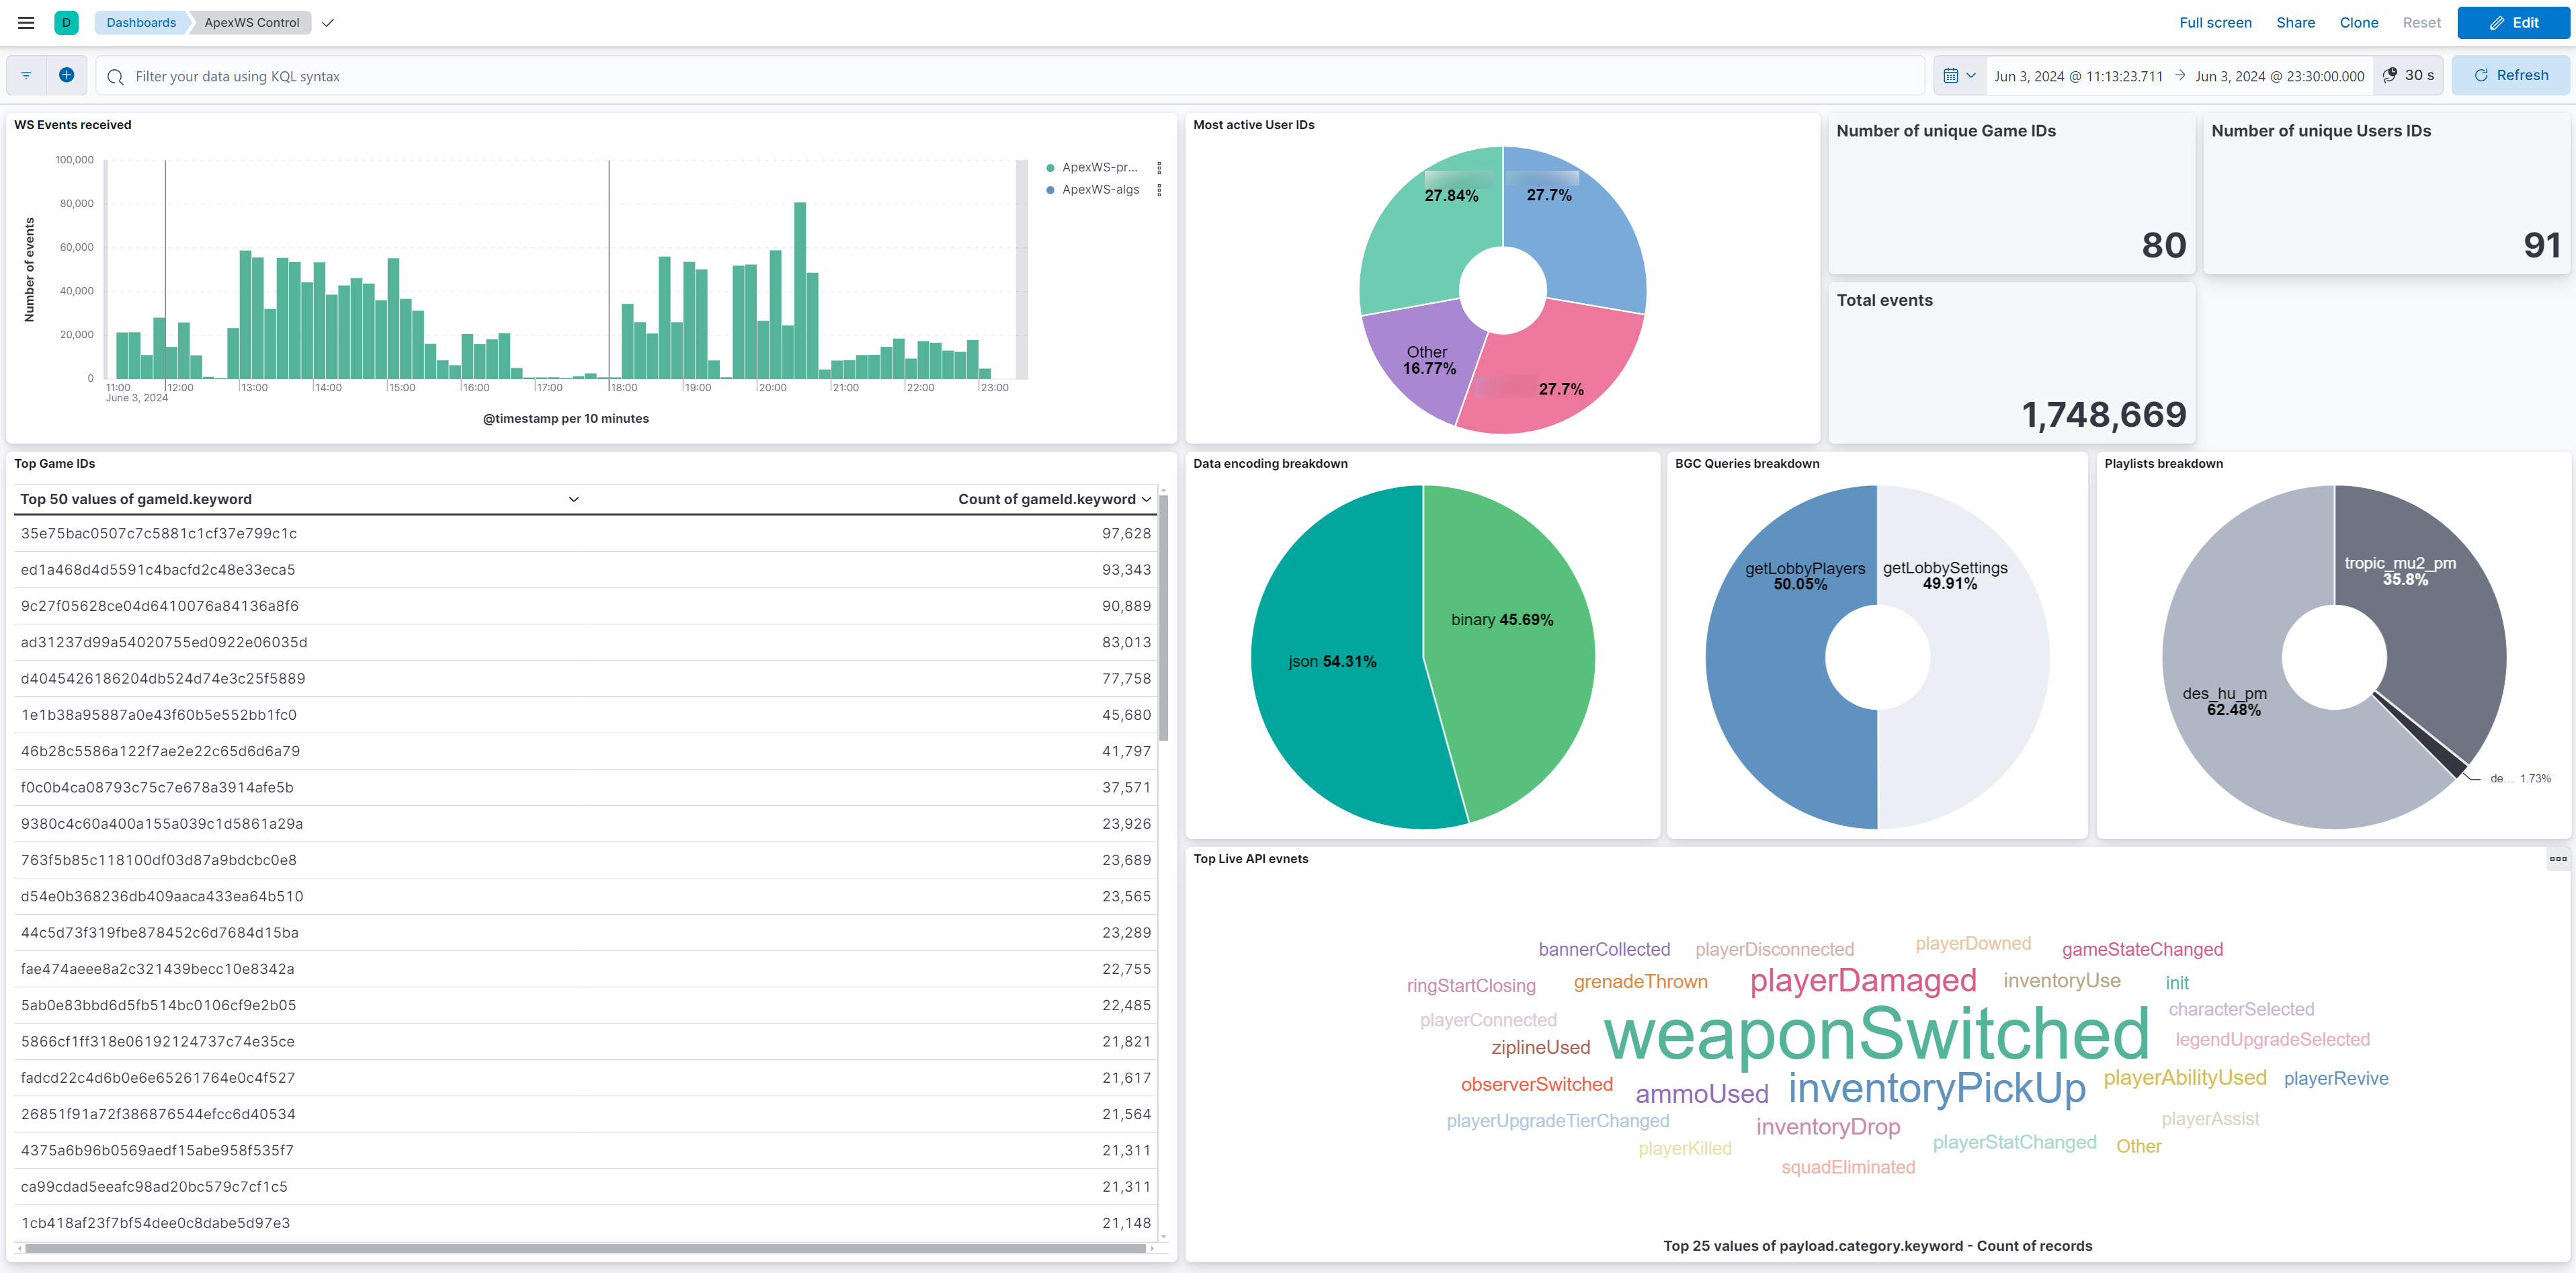
This is an example of a dashboard made using the DGS websocket server data. We can filter data in each individual visualisation, with a lot of different types of viz. Possibilities are limitless, and can really help on a security or data analysis point of view.
On the performance side of things, everything has been running pretty smoothly so far on a single ELK node. The node ingests between 100 and 500 events per second most of the time without much trouble, storage being one of the main issues: most of the logs are kept for 30 days only (which is more than enough in most cases), while some others have a much longer retention period to comply with obligations. The Logstash + ELK combo eats quite a lot of CPU power and RAM however, this kind of traffic wouldn’t run on a Raspberry PI.
As a sidenote, data retention is handled using what we can Index Lifecycle Policies, which moves data in a specific storage tier (hot, warm, cold, delete) depending on how old the data is. You would typically move it down gradually through warm and cold, and finally delete when you want to get rid of that data.
Why not Opensearch
Quite a long time ago, I decided to give a try to Opensearch, a fork based on ELK before they changed their licensing. While it works, my main issue was the lack of updates and how late it was on new features compared to ELK. The UI/UX also feels much better overall on ELK compared to Opensearch. Hopefully I’ll be able to jump back to Opensearch after the product grows!
Online resources are also much more available for ELK compared to OS, where it’s sometimes quite painful to find any documentation or info about what you’re trying to achieve.
ELK feels overall much better on a day-to-day usage.